Power Monitoring
KPM31 single-phase DIN Rail Prepaid Energy Meter integrates data acquisition and control functions
Learn MoreIn traditional commercial building operations, monthly electricity bills often only provide a vague total. They tell you how much you spent last month, but fail to answer the most crucial questions: Where exactly was this energy consumed? Who is wasting it?
With the widespread adoption of sub-metering technology, energy auditors now have access to what's essentially an "X-ray machine." By installing individual smart energy meters on different floors, for different tenants, or for specific large installations (such as chillers or lighting systems), we can capture granular energy consumption data in real time.
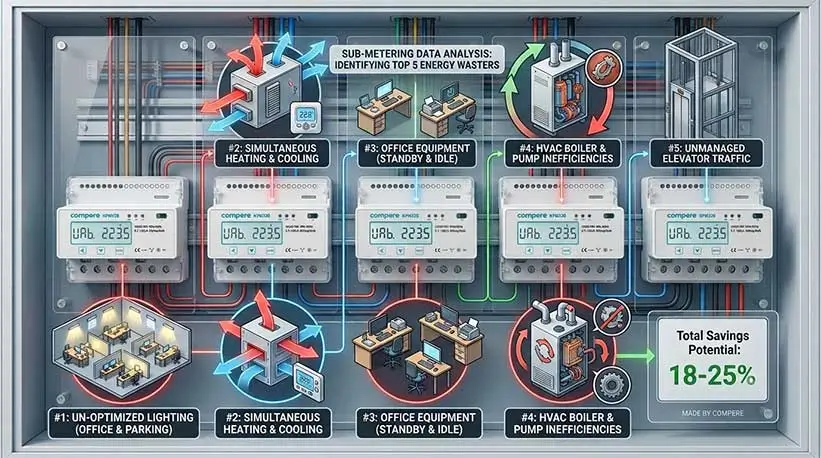
Below are the five most frequently identified "energy killers" in office buildings through sub-metering data analysis.
Data Performance
When analyzing individual metering data for "daily energy consumption curves," auditors often find that between midnight and 5 a.m. (when the building is completely vacant), the energy consumption curve does not drop to near zero as expected, but instead remains at a considerably high base load (typically 30% to 50% of the daily peak load).
Underlying Causes
Leftover Equipment: Employee computers, printers, water dispensers, and other equipment remain on standby overnight.
Unnecessary Lighting: Office areas, break rooms, and even empty meeting rooms are brightly lit all night.
Optimization Recommendations
Identify which floor or tenant has an excessively high nighttime base load through individual metering and implement automated controls (such as installing socket timers, automatically cutting off unnecessary power at night, or using infrared sensors to control lighting).
Data Performance
When auditors compare the energy consumption data of chiller units and boiler/electric heating systems on the same floor on the same timeline chart, they are often shocked to find that both systems are operating at high speeds during the same period.
Underlying Causes
This is usually due to conflicting setpoints in the Building Automation System (BAS) or sensor malfunctions. For example, the central air conditioning system may be working to cool a certain area, while the terminal fan coil units (VAVs) in that area may have activated reheat functionality due to sensor misinterpretation.
Optimization Recommendations
Set strict deadband times/deadband temperatures (e.g., the system neither heats nor cools between 21°C and 24°C). Individual metering data can quickly reveal which areas are experiencing system "mutual heating and cooling," guiding technicians to recalibrate sensors.
Data Performance
Office buildings often house IT rooms serving local servers. Individual metering data typically shows that these areas, equipped with precision air conditioning (CRAC), have energy consumption curves that remain flat and consistently at peak levels, unaffected by external weather changes.
Underlying Reasons
Many enterprise operations personnel, in an effort to protect equipment, blindly set server room temperatures to extremely low levels (such as 18°C or even lower). In fact, according to modern ASHRAE (American Society of Heating, Refrigerating and Air-Conditioning Engineers) standards, maintaining server inlet air temperatures between 20°C and 25°C is perfectly safe and more economical.
Optimization Recommendations
Introduce hot and cold aisle isolation design and add temperature monitoring next to the individual metering. Gradually increase the server room set temperature; for every 1°C increase, precision air conditioning can save approximately 4% of energy.
Data Performance
Individual metering shows that dedicated meters for areas such as parking lots, safety passages, and outdoor landscape lighting continue to consume significant amounts of electricity even under the blazing sun.
Underlying Causes
Failed Photosensitive Sensors: Sensors responsible for automatically switching lighting on and off based on outdoor light levels are covered in dust or damaged.
Timers Not Adjusted for the Season: The timer in the control system is still set to winter time, resulting in streetlights remaining on until 7 AM even when it's already bright at 5 AM in summer.
Optimization Suggestions
Utilize daytime energy consumption data from individual metering as an alarm trigger threshold. Once daytime public lighting consumption exceeds the limit, the system automatically sends a work order to the property management to replace the lights with smart LED light-controlled or radar-sensor-based fixtures.
Data Performance
Independent metering of core equipment such as chillers, large water pumps, and elevators revealed that electricity consumption this year has increased by more than 15% compared to the same period last year under the same building load, or equipment is frequently starting in low-efficiency ranges ("overloading").
Underlying Causes
Lack of Maintenance: Scale buildup in condenser pipes and clogged filters force compressors to operate under overload conditions.
Lack of Variable Frequency Control: Water pumps or fans run at full speed even under light loads.
Optimization Recommendations
Use individual metering data for predictive maintenance. When data indicates that the coefficient of performance (COP) of a piece of equipment is declining, timely cleaning, descaling, or adding a variable frequency drive (VFD) can prevent minor problems from escalating into high electricity bills.
Without measurement, there is no management. Individual metering data analysis elevates office building energy management from "guessing based on experience" to a new dimension of "speaking with data."
By addressing these five major energy killers one by one, office buildings can typically reduce their overall annual energy costs by 15% to 30% without compromising employee comfort.

Power Monitoring
KPM31 single-phase DIN Rail Prepaid Energy Meter integrates data acquisition and control functions
Learn More
Power Monitoring
The KPM33 Three-phase DIN-rail 4G Prepaid Energy Meter is designed for DIN-rail mounting.
Learn More
Power Monitoring
The KPM37 4G Three-phase OEM Energy Meter features a 35mm DIN rail mounting design and an LCD display.
Learn MoreCompere provides the integrated energy management solution including online monitoring, analyzing, reporting, controlling, maintenance, production management, prediction, and other functions. We offer u technical support and professional solution at 7*24h service.
Unit 1, Building 38, LIANDONG U Valley, No. 352 Lianhua Street, High-tech Zone, Zhengzhou, China
Our helpline is always open to receive any inquiry or feedback.Please feel free to drop us an email from the form below and we will get back to you as soon as we can.
Compere mainly provides kpm series smart energy meters. If you have any needs, please feel free to contact us.